WebPagetest - distributed web profiler
There are many popular tools for web performance profiling/debugging these days. From my personal tool set I could mention Firebug, IE Developers Toolbar (integrated with IE from version > 8) or Fiddler. The common problem with those tools is that they are installed and run locally on developers machine. Sometimes, for example when behaviour of the web app depends on loading all elements in the specific order or time, it is important to determine if those factors vary in different geographical locations. The download speed for China and Germany could be very different. If you face with this kind of problems I could recommend you a great distributed web performance profiler - WebPageTest.
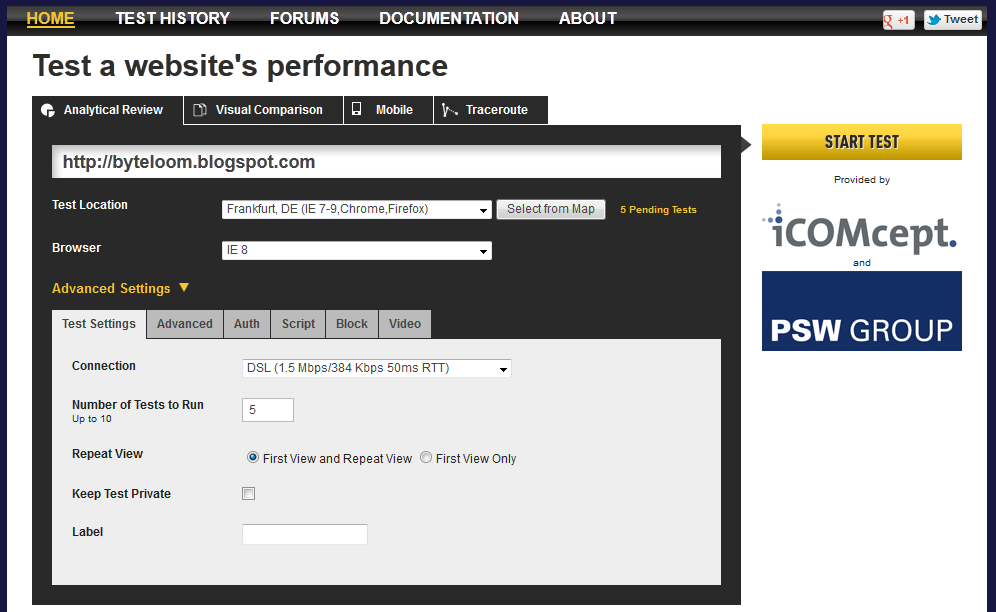
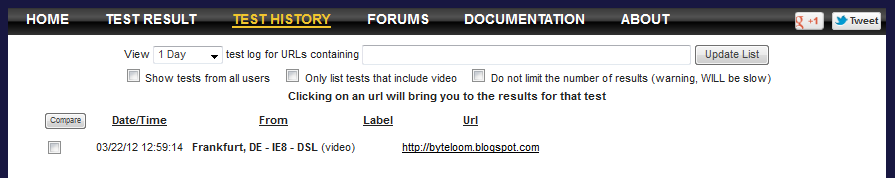
With this tool you can run a series of tests for a given URL, defined location (many available around the world) and browser. This is the most basic operation but you can choose also the visual performance comparison with other pages, test for mobile browsers or trace-route.
For the basic web performance test you can specify (in advanced options) connection speed, number of test to repeat, network packet tracing (in tcpdump format for further analysis), authorization, adds blocking and many other stuff. You can script operations to perform on target page.
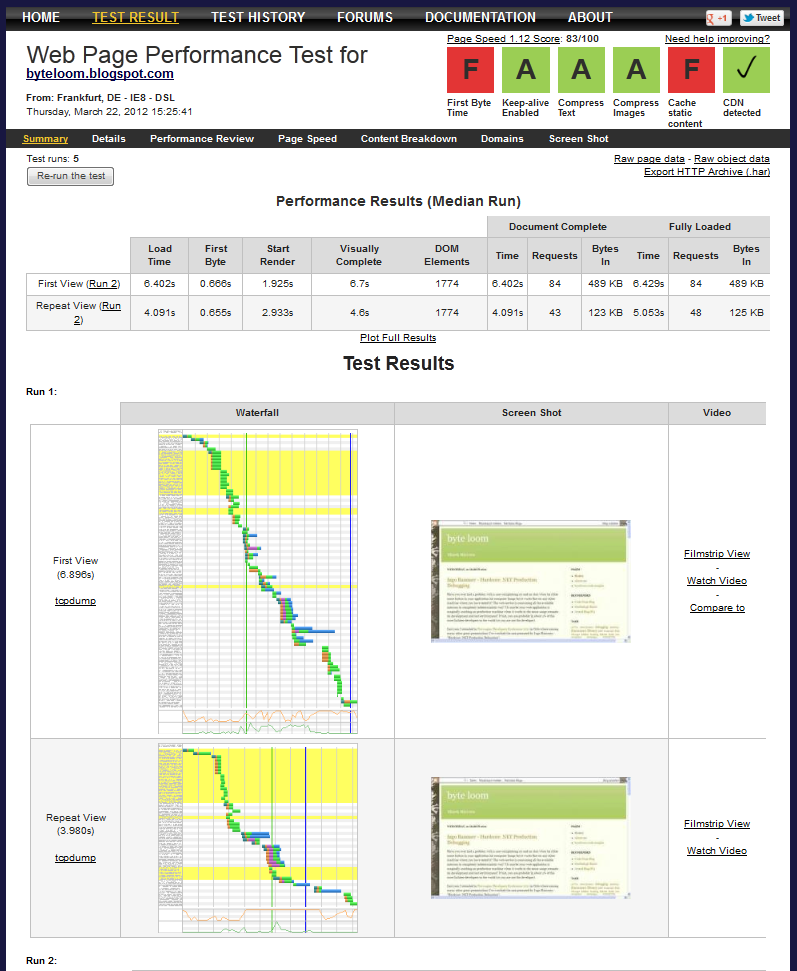
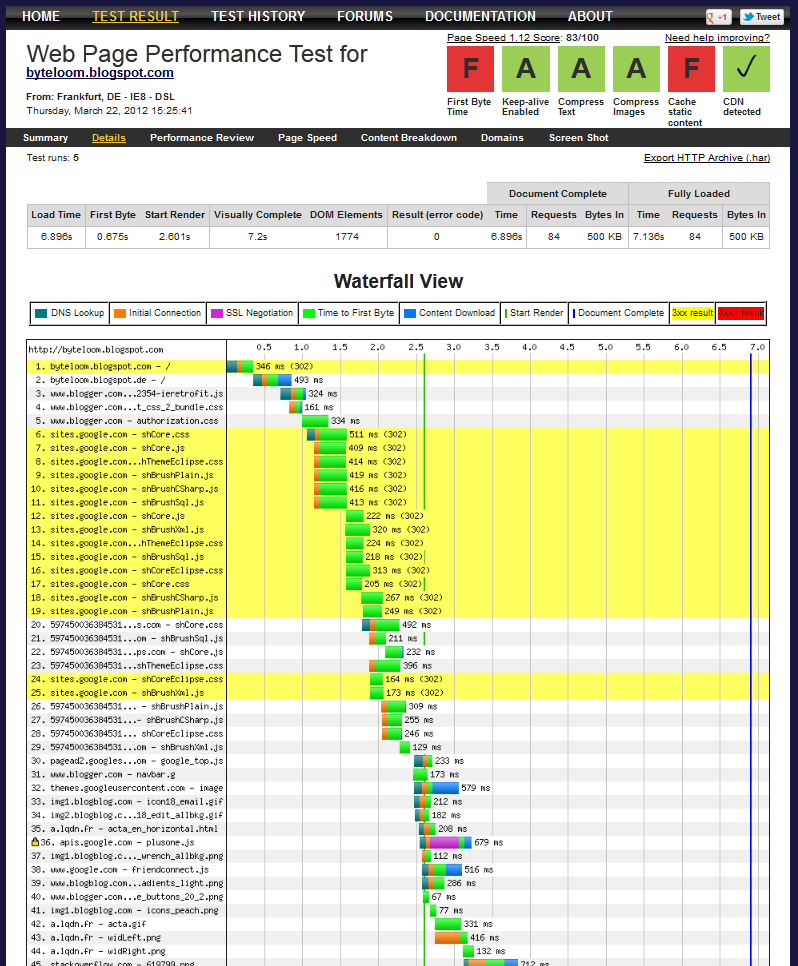
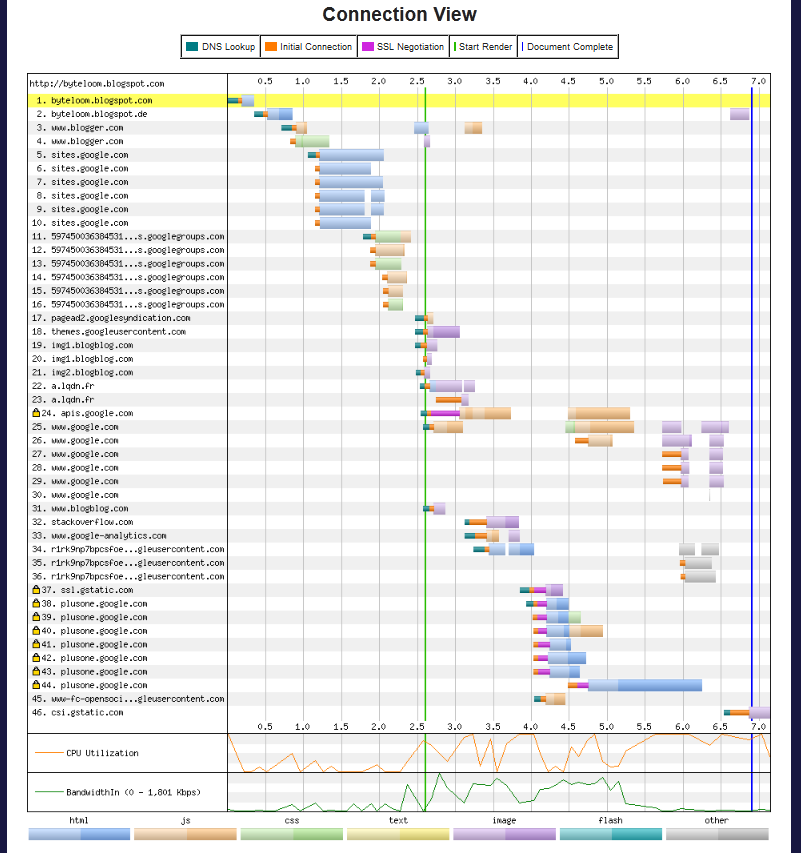
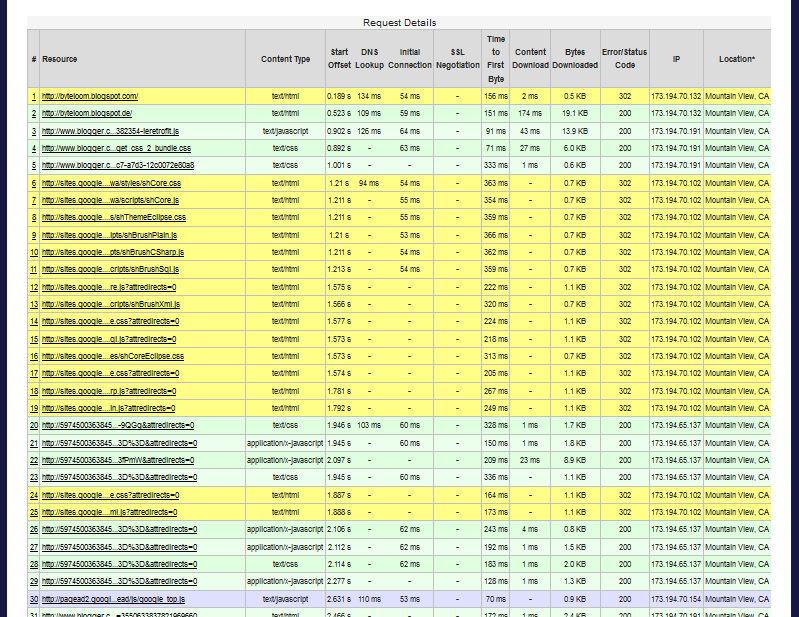
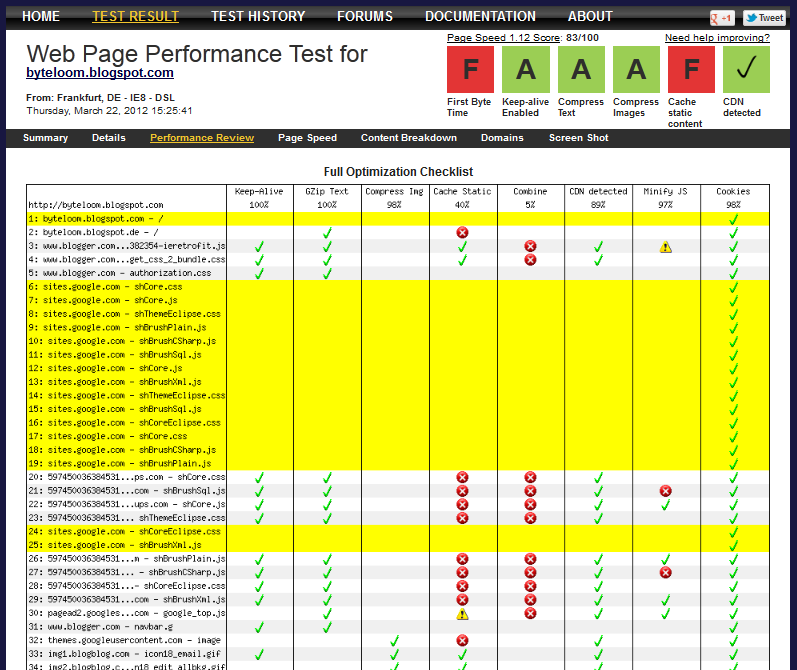
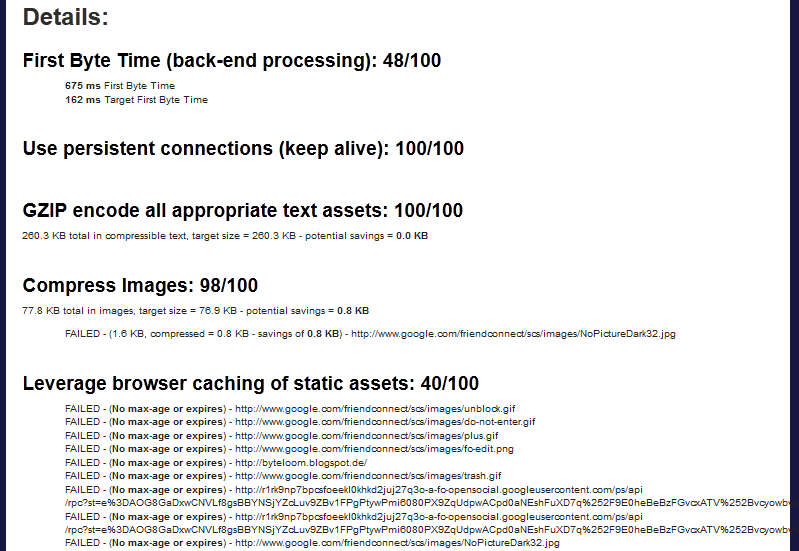
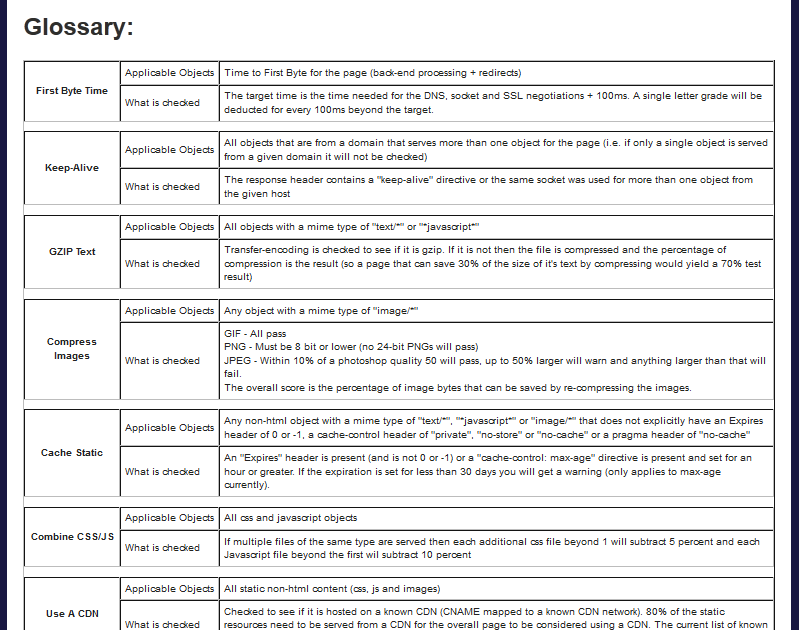
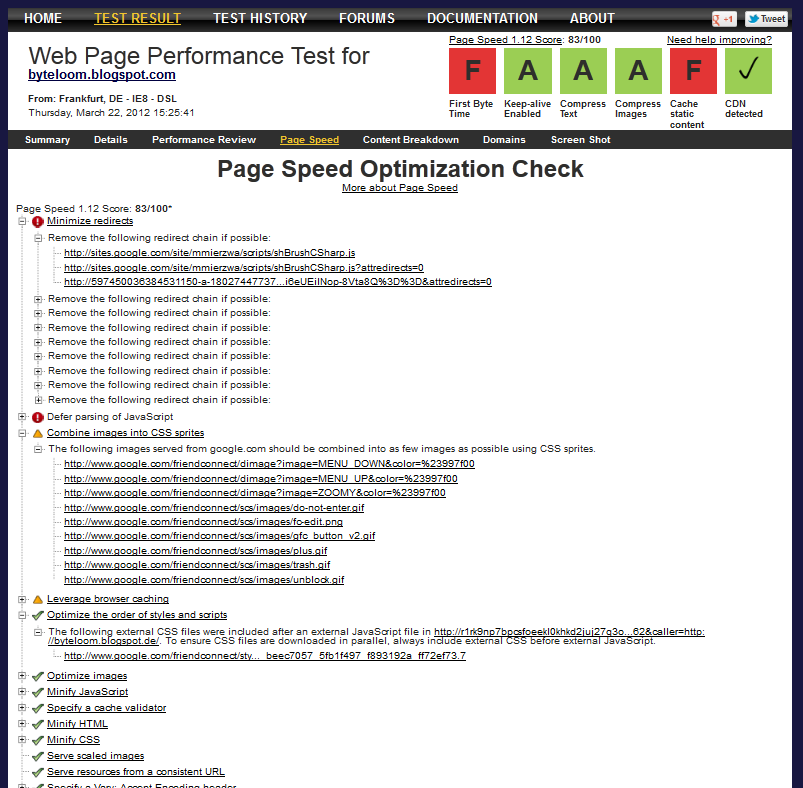
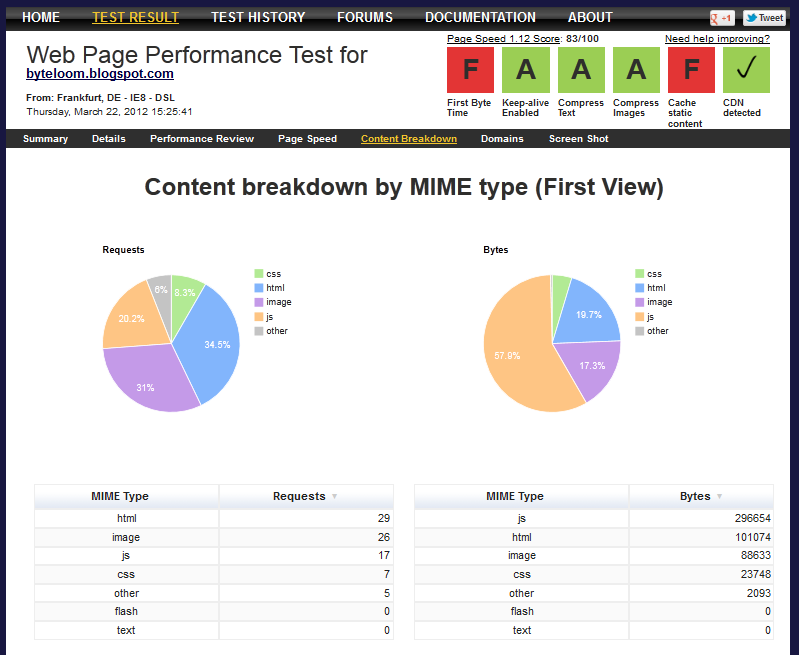
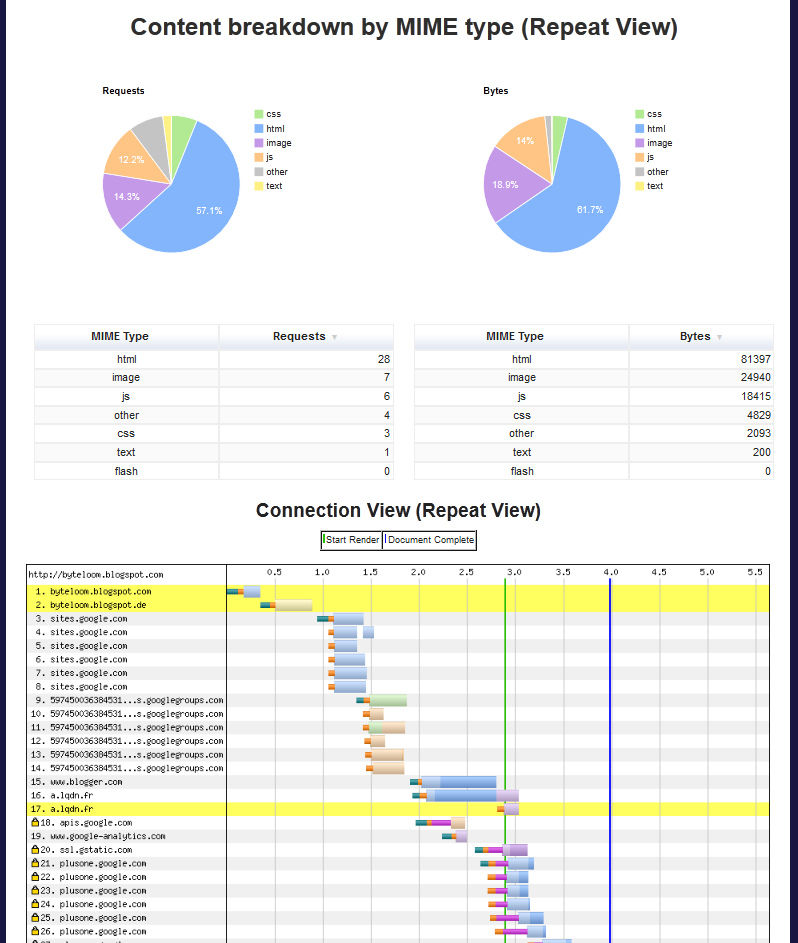
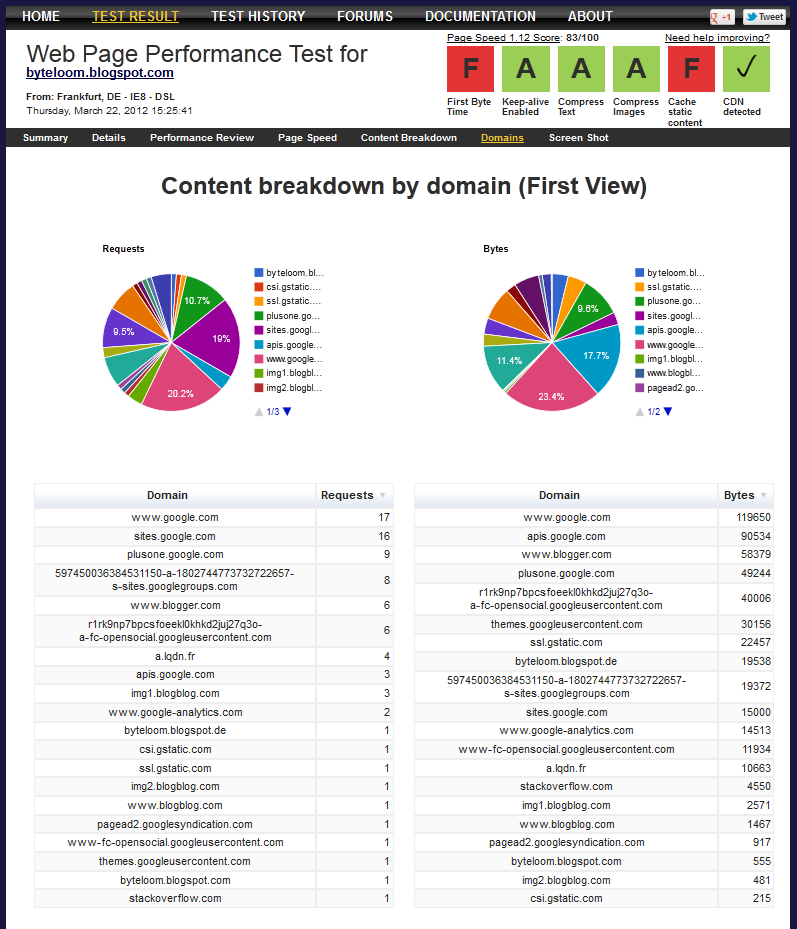
In tests summary among standard metrics like loading time for scripts, styles, images and other elements, timing charts and content breakdown charts you will see a detailed HTTP requests/response report (with timing/offset not only for download itself but with DNS lookup or initial connection time). Next report tabs show a performance review with scoring and suggestions how you could improve you web page (by tuning some of the HTTP server settings like compression, utilizing CDN, caching or combining/minimizing JS/CSS). This feature should be familiar to all users of PageSpeed (for Firebug as additional plug-in, for Apache as module etc.).
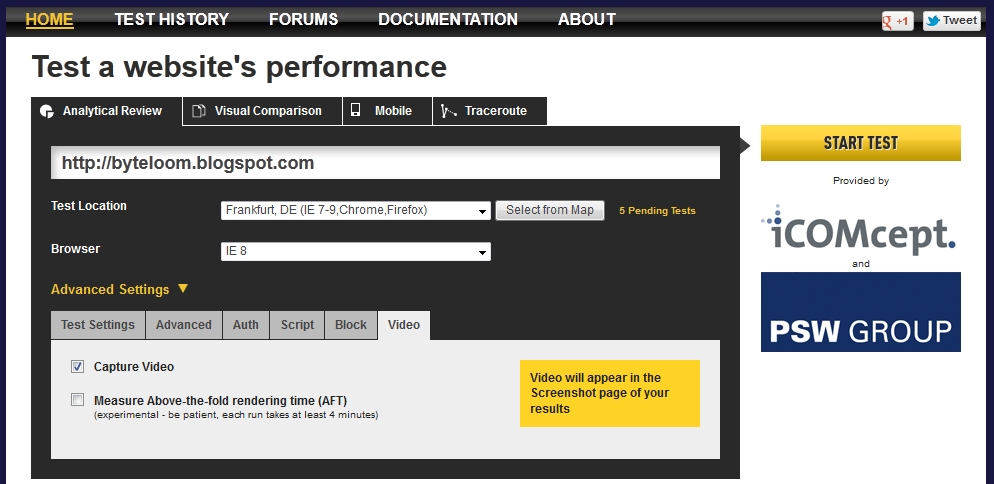
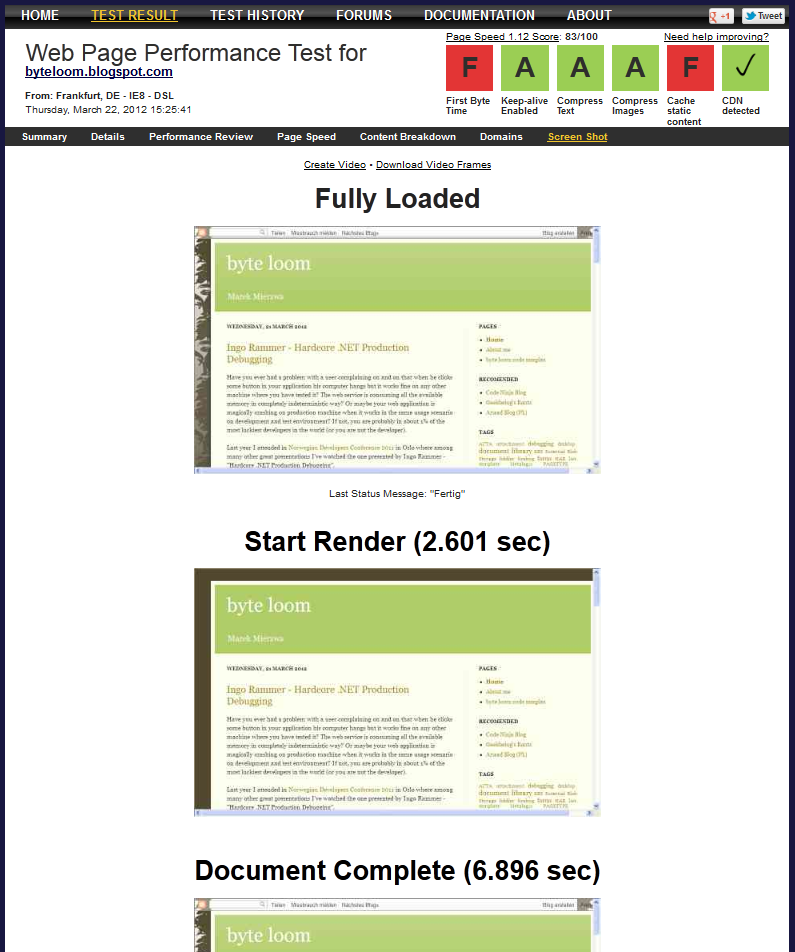
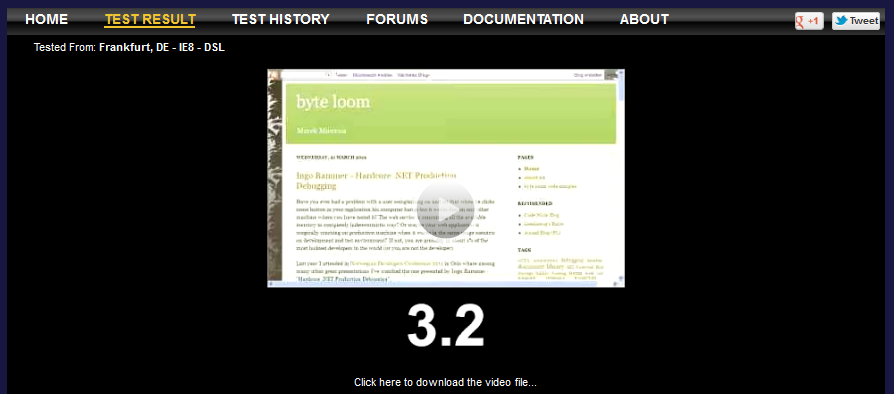
In the end you can see how the user in previously defined location and web browser would see your page when it started loading and when the page has been fully loaded. This is available both on screen shots or in a captured video (the last one should be set in advanced options prior to the test). You can also save all the results in HAR (HTTP Archive) or CSV format (and tcpdump if you selected the right option).
In the project documentation I found some information about REST API and CLI for batch processing:
This command-line tool performs simple one-off batch testing. It loads the set of URLs in the input file as a batch, submits all of them to WebPageTest server which performs the tests, and then downloads the results of the successful tests and reports the failing tests. This tool is mainly implemented by the APIs in our batch processing library and hence can also serves as a sample usage of the batch processing APIs.
This sounds very interesting and I think I’ll investigate this in future.

Have a nice profiling with WebPageTest!